
In many organisations today you’ll hear something like this: the CEO turns to the CTO or Head of Engineering and says,
“We want metrics. How much is this engineering team costing us - what’s the productivity, what are the outputs, what’s the value?”
That same dynamic plays out across finance, operations, project delivery, and business-intelligence teams: “Show us the numbers.”
But the old answer - manual reporting, spreadsheets every week, dashboards updated with human effort, emails pinging around - simply isn’t sufficient anymore.
1️⃣ What manual reporting really means (and its hidden cost)
Manual reporting typically involves pulling data from multiple systems (ERP, CRM, project management, finance, spreadsheets), performing transformations (ETL), building tables or dashboards, exporting PDFs or spreadsheets, distributing them via email or Slack, then manually chasing questions, clarifications, revisions.
This workflow is:
- ⏳ Time-consuming - many hours spent by analysts or engineers just preparing the reports instead of interpreting them.
- 🧩 Latent - by the time the report is distributed, the data may already be stale. As one guide notes, the biggest challenge for BI reporting is “data latency and timeliness”. Decision Foundry+2wynEnterprise+2
- 💤 Siloed and error-prone - inconsistent data definitions, spreadsheets overwritten, ad-hoc fixes, version control issues. Data quality and standardisation become major risks. Decision Foundry+1
- 📉 Limited in scope - manual reports often track historical KPIs, but rarely deliver real-time insights or predictive foresight. That gap is increasingly noticeable. Argos Software+1
From an engineering productivity perspective, it is worth noting: when your engineering team is asked to “show metrics”, the metrics are often after-the-fact, manual, lacking alignment with upstream data flows, and thus sub-optimal for real decision‐making.
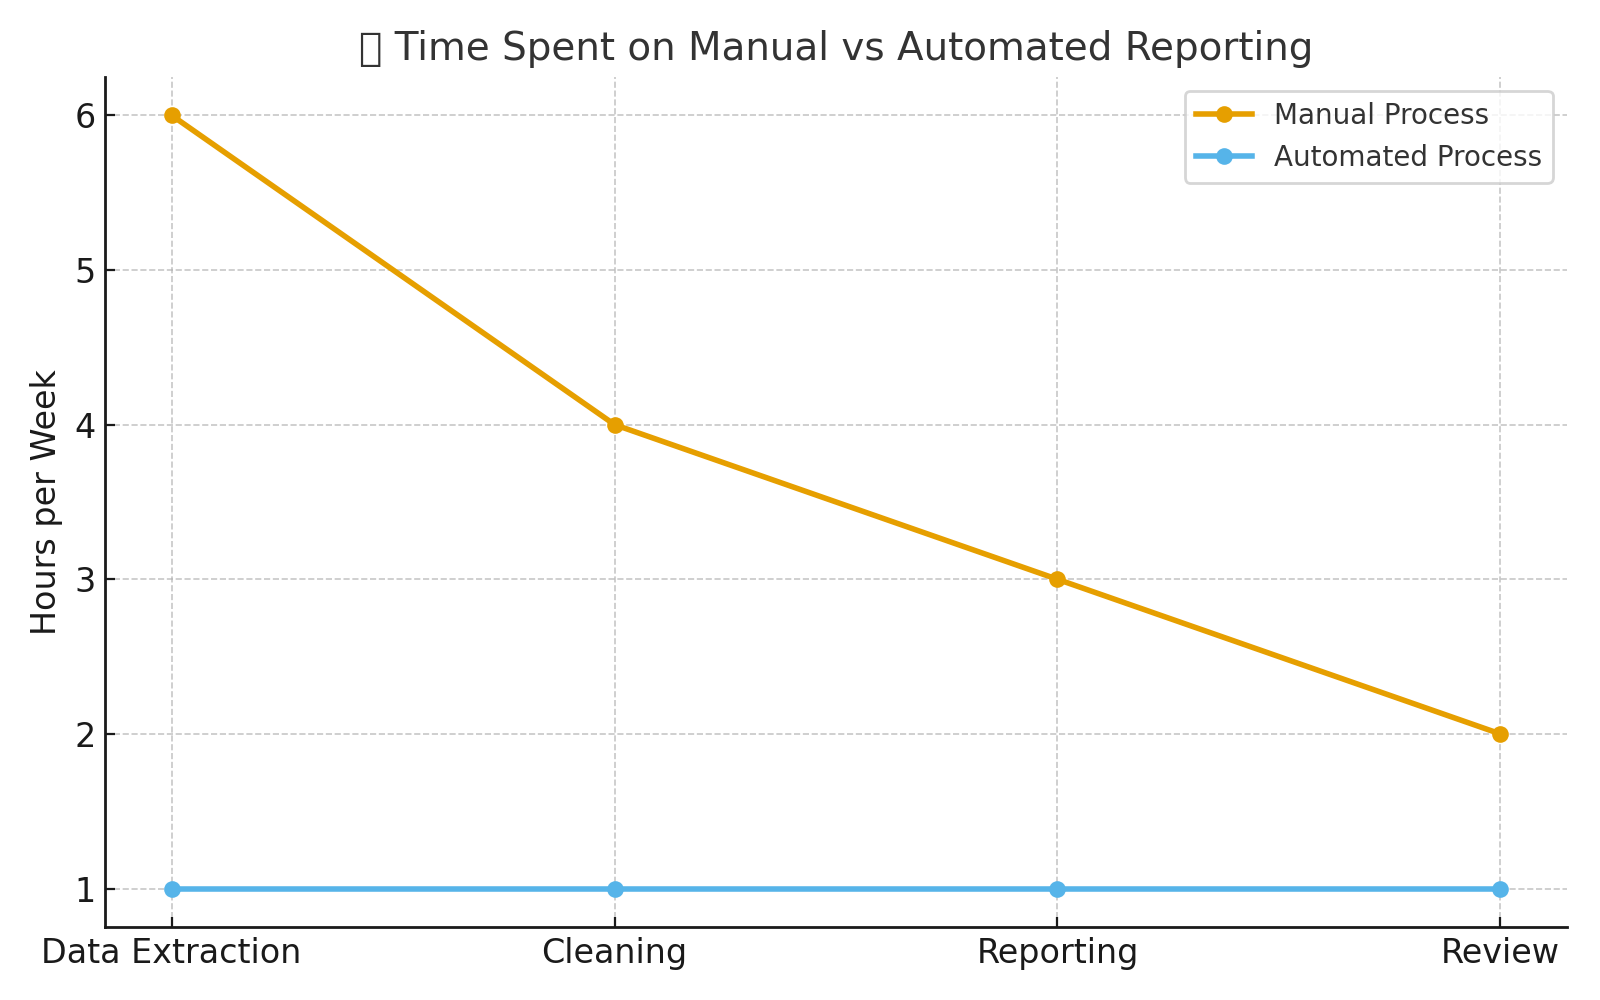
Comparison line chart showing hours spent per reporting phase in manual vs automated systems - manual workflows require 6× more time on data extraction, cleaning, and review.
2️⃣ Why the shift to automation and Intelligence is inevitable
Several technology and business trends make manual reporting increasingly untenable:
- ⚙️ Volume and velocity of data: As organisations adopt more tools (microservices, cloud systems, IoT, field data), the number of data sources grows - reporting must integrate them. A recent survey on BI trends notes that the biggest challenge is not collecting data, but “making sense of complex, scattered datasets and turning them into strategic decisions at scale.” Improvado+1
- 🕒 Demand for real-time insights: Static weekly/monthly reports lose relevance when operations change daily or project cost overruns spiral within hours. BI best-practice calls out “deliver timely and interactive insights” as a must. Decision Foundry
- 🧠 Emergence of AI / ML / automation: The integration of AI in enterprise automation is no longer hypothetical. For example, a technical framework paper outlines enterprise-AI and automation integration architectures across BI systems. IJFMR Another article highlights how “intelligent automation” – combining AI + robotic process automation – is delivering measurable productivity and precision improvements. Enterprise AI World
- 💡 The business need for agility: CFOs and COOs increasingly want to move from “what happened” to “what will happen” and “what should we do now”. That requires more than static reports-it requires intelligence embedded in workflows, feedback loops, anomaly detection, and prescriptive action.

3️⃣ What a modern “intelligent reporting” architecture looks like
Engineers, analytics leads and BI architects should be familiar with the core technical components. A mature “reporting + intelligence” stack typically includes:
a) Unified data ingestion & processing layer
- Data from transactional systems (ERP, CRM, project tools) + semi-structured/unstructured sources (logs, documents) are pulled into a central data store (data warehouse/lake). Wikipedia
- ETL/ELT pipelines validate, cleanse, standardise, and transform the data. Good BI guidance emphasises “clean and quality data: the lifeblood of BI reporting”. Decision Foundry
- Metadata management, data lineage, and governance (so you know where the data came from and how it was transformed). For example, “data lineage” helps trace how a data point moved through the system and is critical for audit/compliance. Wikipedia
b) Near-real-time analytics and automation layer
- Streaming ingestion or micro-batches allow frequent refresh of data, reducing latency.
- Rules engines, anomaly detection models, machine-learning modules detect patterns (e.g., cost overruns, schedule slippage, resource bottlenecks).
- Intelligent automation (RPA + AI) handles tasks such as data extraction, transformation, exception-handling workflows, and even report generation. SHRM+1
- A governance framework for model lifecycle (ModelOps) is increasingly needed as ML/AI models move into operations. Wikipedia
c) Adaptive reporting, dashboards and embedded actions
- Instead of static PDF spreadsheets, dashboards are interactive, allow drill-down, alerting, contextual interpretation. BI best practice emphasises “deliver timely and interactive insights”. Decision Foundry
- Embedded analytics: insights push into user tools (email, Slack, mobile) so decision-makers receive relevant triggers.
- Prescriptive elements: beyond “here’s what happened”, “here’s what you should do”. For example, detect a variance today and trigger a workflow to investigate.
d) Feedback loops and continuous learning
- As data flows and decisions are made, the system learns (via ML) which alerts were acted upon, which were false positives, adjusting thresholds and model weights.
- Integration with domain knowledge (engineering, finance, operations) means the system becomes smarter, not just regular. The technical framework for AI-automation integration covers this. IJFMR
These architectures enable reporting that thinks - not just displays.
4️⃣ Why engineering & analytics teams should care (and act)
From the perspective of someone in analytics, data science, or engineering (as you are), moving away from manual reporting has direct benefits:
- 🧮 Focus on value-added work: Instead of spending 50–70% of your time prepping data and reports, you can spend more time interpreting, building models, and advising stakeholders.
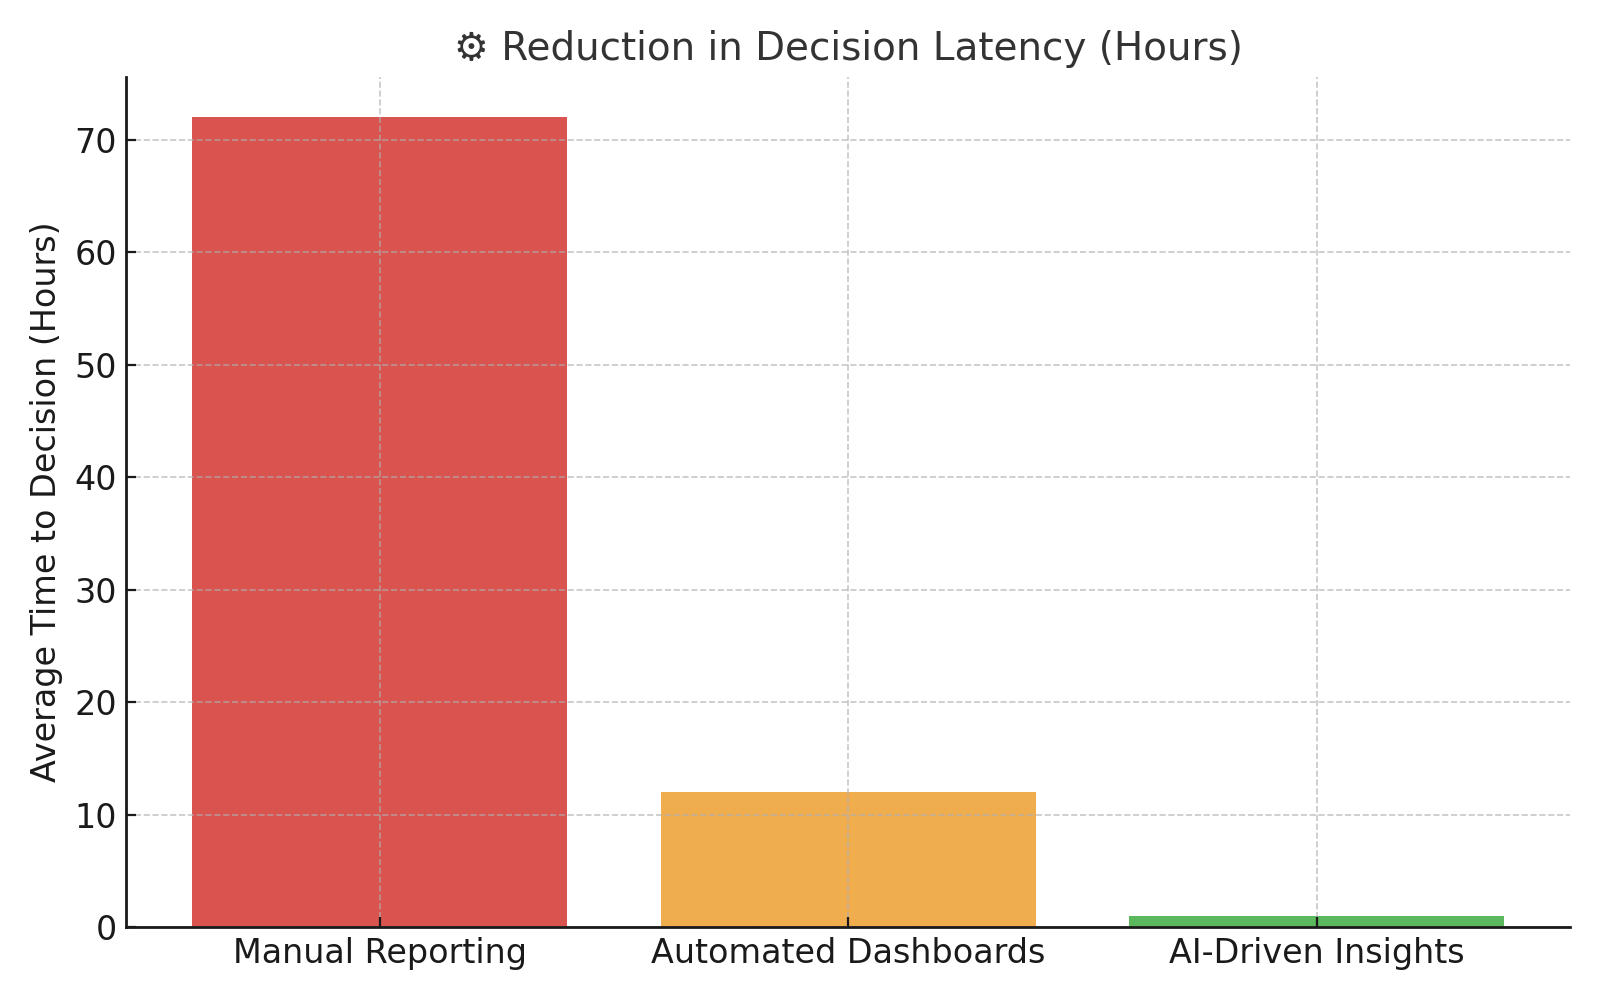
- 🚀 Faster decision cycles: When insights are timely and embedded, you move from months to hours/days. That reduces lag between signal and action.
- 📊 Better alignment with business goals: Reports become living systems aligned with KPIs, not static snapshots that are outdated before they’re seen.
- 🔁 Engineering productivity visibility: When your engineering team is asked to measure productivity, you want metrics that are meaningful and actionable - not just “lines of code” or “story points delivered”. An intelligent reporting layer can surface things like deployment frequency, rollback rate, cost per feature, and business value delivered.
- 🏆 Competitive advantage: Organisations that shift from manual to intelligent reporting are better equipped to detect risk, adapt strategy, and optimise execution. As one McKinsey article notes in the consumer sector, “we estimate that by 2030, about 30-35 % of current activities could be automated” and that automation/augmentation will drive value. McKinsey & Company
5️⃣ Common pitfalls when you ignore this transition
- 🕰️ Stale data/decisions: If you’re still relying on weekly/monthly manual reports, decisions may be based on yesterday’s truth, not tomorrow’s trend.
- 🧾 Report fatigue: Stakeholders receive many reports but don’t act on them because they are not timely or are overloaded with irrelevant details. One guide notes that many BI reports fail because “your audience isn’t reading or acting on the data you’re sharing”. wynEnterprise
- 🔒 Analytics backlog: While you spend time building reports, there’s little time left for innovation - your backlog grows, and engineer/analyst frustration builds.
- 📊 Integration risk: If manual workflows aren’t replaced with repeatable, automated processes, you create brittle systems where a change in a spreadsheet or a connector breaks the chain.
- 🧑💻 Skill mismatch: As AI and automation evolve, analysts and engineers who are stuck in manual-reporting mode risk being misaligned with the business’s needs (automation, decision-support, forecasting).
6️⃣ How organisations make the shift (brief playbook)
Here’s a high-level roadmap (technical teams can translate this into tasks) for moving from manual reporting → intelligent reporting:
- 🎯 Step 0: Clarify objectives & metrics: What are the key decision-points? What are the KPIs (engineering cost/efficiency, project ROI, resource utilisation, schedule-variance)?
- 🗺️ Step 1: Inventory data sources & reporting workflows: Map where data lives, how it is currently extracted, transformed, and reported. Document data lineage and governance.
- ⚙️ Step 2: Automate ingestion & transformation: Build ETL/ELT pipelines, implement data quality checks, standardise schemas.
- 🔁 Step 3: Implement streaming or frequent refresh processes: Move away from monthly snapshots → near-real-time (as business critical).
- 📈 Step 4: Embed analytics and automation: Use ML/AI to detect anomalies (cost overruns, resource bottlenecks), generate alerts, push insights into workflows.
- 📱 Step 5: Build dashboards + action triggers: Interactive dashboards for stakeholders, alerting mechanisms (email/Slack), embed prescriptive workflows.
- 💬 Step 6: Define feedback loops: Monitor which alerts led to decisions, model performance over time, refine thresholds, and build continuous improvement.
- 🔐 Step 7: Governance, ModelOps & organisational change: Ensure you have model lifecycle management, versioning, auditing, and training for users. Use frameworks like ModelOps. Wikipedia
- 📊 Step 8: Measure outcomes: Move beyond “we ran reports faster” to “we made decisions faster / saved cost / improved ROI”.

7️⃣ Neutral narrative example: measuring developer productivity
Let’s revisit the CEO-CTO scenario: The CEO says, “We want metrics for the engineering team.” Common manual-reporting answers might be: number of commits, story points completed, and sprint velocity. But those are blunt instruments. They don’t connect cost, output, value, and business impact.
In a modern architecture, you might instead:
- Ingest data across the development toolchain (code commits, pull requests, test failures, deployment frequency), project management (story points, features), and cost systems (team salaries, contractor spend).
- Build a model that correlates features delivered / bugs resolved / deployment frequency with business metric (e.g., customer retention, revenue per feature, cost per feature).
- Set up anomaly-detection: e.g., if cost per delivered feature spikes by >20% over the rolling 3-month baseline, trigger investigation.
- Build dashboards that show “Cost per feature”, “Time from commit to production”, “Rollback rate”, “Business value per feature”, and overlay trends with resource spend.
- Automate alerts: when a project overshoots budget or slips into the maintenance cycle, automatically notify engineering + finance + PMO.
- Continuously learn: feed back data from decisions (e.g., “we delayed this feature because of technical debt”) into your models so the system improves.
The key shift: reporting moves from passive (“here are the numbers”) to active decision-support (“here is the risk, here is the deviation, here is what you should do now”).
8️⃣ What does this mean for you?
If you are on an analytics or engineering team, or leading one, manual reporting is no longer enough. The expectations are shifting. The business will want faster insights, predictive signals, alignment between cost, output, and value, and automated workflows that push the right information to the right people at the right time.
To future-proof your role and your architecture, you should ask:
- Are our current reports delivering decisions or just summaries?
- How fresh is our data? Are we reporting on the last period or real-time?
- Can we detect anomalies or risks automatically, or do we rely on someone noticing?
- Do our dashboards align cost → output → business value (not just output → business value)?
- Are we ready to scale analytics rather than scale manual effort?
- Do we have the technical frameworks (data pipelines, ML/AI, automation, ModelOps) to support “intelligent reporting”?
9️⃣ Conclusion
Manual reporting was once a necessary step in the data-driven business journey. But it now limits organisations: slow, stale, error-prone, and disconnected from strategic value. The future lies in intelligent reporting - integrated, automated, adaptive, and embedded into decision workflows. For engineering and analytics teams, this shift is not optional: it’s how you move from “what happened” to “what’s happening and what should we do”.
🚀 Ready to move beyond manual reports?
If you’re looking for an end-to-end solution that replaces spreadsheet-based workflows, integrates across operations, finance, and engineering, automates transformations, detects deviations, and embeds intelligent alerts, then it’s time to talk to Aden.
Sign up today and let Aden turn your reporting function into a decision engine - not just a burden.